The Cosmic Ice Laboratory - IR Spectra
The Cosmic Ice Laboratory - IR Spectra
Links to IR spectra in various formats are available in the following tables.
You can also find data for download on our
Zenodo Community page.
PLEASE NOTE: If you find these spectra helpful in your research, please acknowledge any use by reference to "Hudson et al." and this NASA web site.
Here are the types of spectra on this page:
- IR Transmission Spectra for Amorphous and Crystalline Ices
- Mid-IR Spectra of Molecules Diluted in H2O at 15 - 20 K
- Far-IR Spectra of H2O Ice
- IR Spectra of NH3-Containing Ices (See Moore, M. H., Ferrante, R. F., Hudson, R. L., and Stone, J. N. (2007). Ammonia—Water Ice Laboratory Studies Relevant to Outer Solar System Surfaces. Icarus, 190, 260-273.)
Mid-IR Transmission Spectra of ices - D2O and Ethylene Glycol at Three Temperatures
This Excel file contains data for D2O and ethylene glycol ices at three temperatures. The reference is Hudson (2025), Monthly Notices of the Royal Astronomical Society, 542, 96-103. doi: 10.1093/mnras/staf1199.Mid-IR Transmission Spectra of Amorphous Ices Containing HNCO at 10 K
This Excel file contains data for HNCO, H2O + HNCO, and H2O + HNCO + NH3. The reference is Gerakines et al. (2025), Monthly Notices of the Royal Astronomical Society, 537, 2918-2924. doi: 10.1093/mnras/staf192.Mid-IR Transmission Spectra of HNCO, H2CO, and HCOOH
This Excel file has IR spectral data for HNCO, H2CO, and HCOOH. The reference is Hudson et al. (2024), The Astrophysical Journal, 977, 130. doi: 10.3847/1538-4357/ad8c43.Mid-IR Transmission Spectra of Crystalline 1-Propanol
This Excel file has mid-IR spectral data for crystalline 1-propanol. The reference is Hudson (2024), Monthly Notices of the Royal Astronomical Society, 534, 2525-2532. doi: 10.1093/mnras/stae2244.Mid-IR (4000-400 cm-1) Transmission Spectra of Twelve Amorphous Ices
The Excel file here has mid-IR spectral data for ethane, 2-propanol, propene, acetic acid, methyl formate, methanol, ethanol, 1-propanol, formaldehyde, ammonia, isocyanic acid, and hydrogen cyanide. The reference is Hudson & Gerakines (2019), Monthly Notices of the Royal Astronomical Society, 485, 861-871. doi: 10.1093/mnras/stz254Mid-IR (4000-400 cm-1) Spectra of Molecules Diluted in H2O at 15 - 20 K
H2O + N2O (10:1)
Water + Nitrous Oxide (dinitrogen oxide) (10:1) at T = 18 K
Far-Infrared Spectra of H2O Ice (read a detailed description here)
H2O deposited at 14 K and subsequently warmed
deposit at 14 K
ASCII [28 kb]
warmed to 40 K
ASCII [25 kb]
warmed to 80 K
ASCII [26 kb]
warmed to 100 K
ASCII [25 kb]
warmed to 120 K
ASCII 24 kb]
warmed to 140 K
ASCII [24 kb]
warmed to 160 K
ASCII [24 kb]
IR Spectra of NH3-Containing Ices
** For details, see Moore, M. H., Ferrante, R. F., Hudson, R. L., and Stone, J. N. (2007). Ammonia–Water Ice Laboratory Studies Relevant to Outer Solar System Surfaces. Icarus, 190, 260-273. **
Figure 1
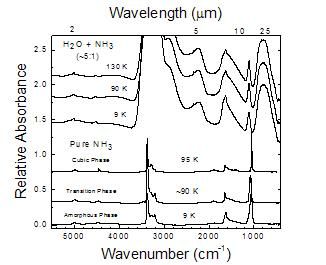
NH3 compared to H2O+NH3 Ices
Figure 2
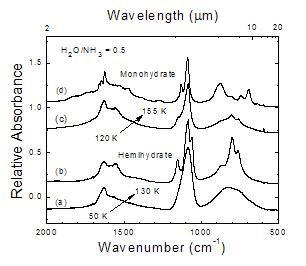
IR spectra of Ices made from H2O/NH3=0.5 gas-phase mixtures
Figure 3
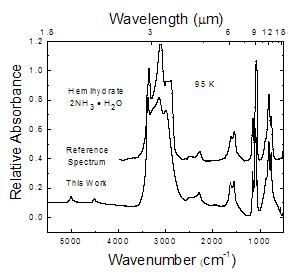
This work compared to a hemihydrate reference spectrum
Figure 4
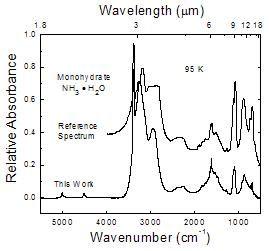
This work compared to a monohydrate reference spectrum
Figure 5
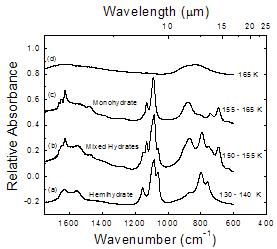
The thermal evolution of hemihydrate 2NH3 � H2O
Figure 6
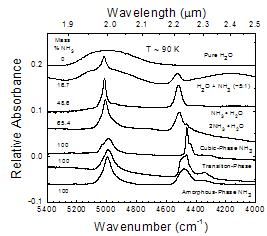
A comparative look at near-IR spectra from 5400 to 4000 cm-1
Figure 7
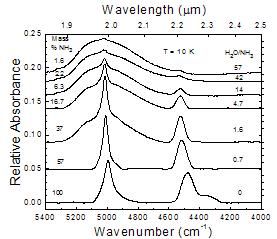
A comparative look at near-IR spectra from 5600 to 4000 cm-1
Figure 9
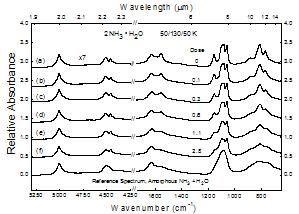
Changes in the near- and mid-IR spectrum of 2NH3 � H2O at 50 K as a function of radiation dose
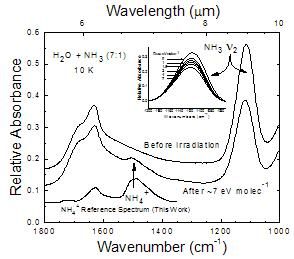
Figure 10
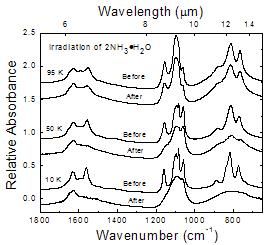
Changes in the IR spectrum of 2NH3 � H2O before and after an irradiation of 2.8 eV molecule-1