Research Page
Precipitation
Advancing our understanding of global hydrological processes requires detailed precipitation estimates on a broad range of time and space scales. Satellite observations provide a critical contribution toward mapping global rainfall and its variability. Over long time periods, monthly precipitation records provide the key information that determines global and regional precipitation trends and separates long-term trends from the large interannual variations in precipitation. On shorter time and space scales, global maps of precipitation and latent heating structure are very useful as validation tools for general circulation models as they attempt to forecast climate conditions. Assimilation of the precipitation information into global and regional models should produce more realistic simulations. On even smaller time and space scales, knowledge of surface rainfall is useful for improving surface hydrology models. The complementary information on storm structure and processes provides insight into unsolved problems in numerical models of precipitation.
Physical Retrievals of Precipitaion Rate and Structure
Estimates of surface precipitation fluxes and precipitation vertical structure from satellite sensors can be used to characterize storm structure and intensity, and to indirectly infer distributions of vertical air motion and latent heat of condensation in precipitation systems. Therefore, in aggregate, these data are also important for global hydrological and energy cycle studies. The most accurate satellite estimates of precipitation rates and vertical structure are currently derived from a combination of spaceborne weather radar and passive microwave (PMW) radiometer observations. The spaceborne radar data reveal the structure of precipitation at relatively high spatial resolution, while the PMW radiometer observations provide a measure of the vertical column-integrated water content of the atmosphere due to water vapor, clouds, and precipitation. Since these atmospheric constituents attenuate the spaceborne radar pulses that are reflected by precipitation, the PMW measurements can be used to help "attenuation-correct" the radar observations. The greater relative accuracy of combined radar-radiometer estimates of precipitation makes them useful not only for direct science applications, but also for calibrating other satellite sensors that have lower accuracy but provide greater sampling in space and time.
The figure below shows a schematic of the Global Precipitation Measurement (GPM) mission Core Observatory (CO), including the scanning of its Dual-frequency Precipitation Radar (DPR) and GPM Microwave Imager (GMI). The GPM CO launched on February 27, 2014. The DPR and GMI represent the next-generation of sensors that were flown on the Tropical Rainfall Measuring Mission (TRMM) satellite (1997–2015). The DPR's two channels generally yield more accurate precipitation particle size distribution and precipitation rate estimates. The GMI has additional higher-frequency microwave channels that are useful for light rain and snow detection.
Laboratory researchers are developing computer algorithms for diagnosing precipitation rates, vertical structure, and latent heating from a combination of the DPR and GMI data; see Bringi et al. (2021) and Grecu et al. (2016, 2018, 2024). In the pre-launch phase of GPM, these algorithms were applied to either TRMM data or synthesized GPM observations. The performance of this algorithm builds on previously-developed TRMM algorithms, but it has the advantage that it can incorporate the additional channel data from GPM (and select other sensors) to improve precipitation estimates.

Diagram illustrating the dimensions covered by the GPM Core Observatory's Dual-frequency Precipitation Radar (DPR) and GPM Microwave Imager (GMI) instruments. NOTE: As of May 2018 the KaPR swath width was shifted to 245km.
• Bringi, V., M. Grecu, A. Protat, M. Thurai, C. Klepp. 2021: Measurements of Rainfall Rate, Drop Size Distribution, and Variability at Middle and Higher Latitudes: Application to the Combined DPR-GMI Algorithm. Remote Sensing 13, 2412. https://doi.org/10.3390/rs13122412
• Grecu, M., G. M. Heymsfield, S. Nicholls, S. Lang, and W. S. Olson, 2024: A Machine-Learning Approach to Mitigate Ground Clutter Effects in the GPM Combined Radar-Radiometer Algorithm (CORRA) Precipitation Estimates. J. Atmos. Oceanic Technol., https://doi.org/10.1175/JTECH-D-24-0048.1, in press.
• Grecu, M., W.S.Olson, S.J. Munchak, S. Ringerud, L. Liao, Z. Haddad, B.L Kelley. S.F. McLaughlin, 2016: The GPM combined algorithm. Journal of Atmospheric and Oceanic Technology, 33, 2225-2245.
• Grecu, M., L. Tian, G.M. Heymsfield, A. Tokay, W.S. Olson, A.J. Heymsfield, A. Bansemer, 2018: Nonparametric Methodology to Estimate Precipitating Ice from Multiple-Frequency Radar Reflectivity Observations. J. Appl. Meteor. Climatol., 57, 2605–2622. https://doi.org/10.1175/JAMC-D-18-0036.1
Global Precipitation Estimates
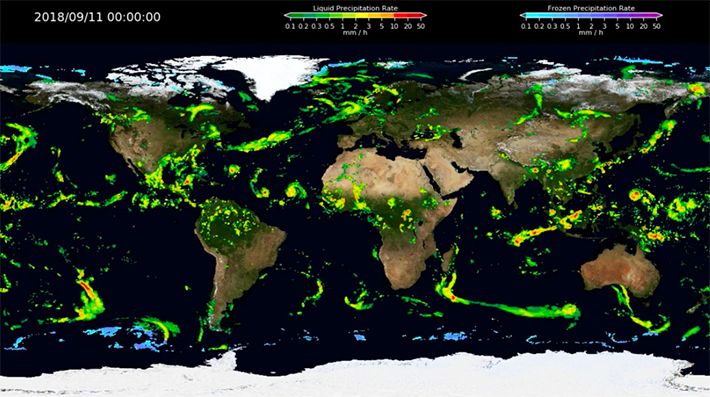
Precipitation dataset users generally require levels of accuracy, coverage, and time/space resolution that are best addressed by combining estimates from several satellites, plus rain gauge data as possible. The MAPL precipitation group develops, produces, and analyzes such precipitation data sets, principally the Integrated Multi-satellitE Retrievals for GPM (IMERG; Huffman et al. 2020). IMERG is a high-resolution precipitation product (HRPP), focused on producing the best fine-scale quasi-global estimate for the TRMM and GPM eras, specifically half-hourly and monthly 0.1°x0.1° latitude/longitude gridded estimates for the entire globe for 1998-present. The main half-hourly and monthly research products are computed 4 months after observation (the Final Run), while two near-real-time versions of the half-hourly product are computed about 4 and 14 hours after observation (the Early and Late Runs, respectively). The Early and Late products provide critical input for a range of analyses, including floods, crops, and drought. See https://gpm.nasa.gov/data/directory for further discussion and pointers to the data.
The group is also responsible for the Global Precipitation Climatology Project (GPCP; Huffman et al. 2023) Monthly and Daily products, which are designed for the long-term homogeneity of Climate Data Record (CDR) standards. The Monthly provides data for 1983–present at 0.5°x0.5° resolution, while the Daily runs 1998–present at 0.5°x0.5°, both fully global. These data are important inputs for climate analysis and climate model validation. As examples, the long-term climatology of precipitation is shown in the upper panel of the following figure in millimeters per day, while the time series of global-average land, ocean, and total precipitation is shown in the lower panel as blue, red, and black lines. Go to https://disc.gsfc.nasa.gov/ and search on “GPCP” to access the most current version of the Monthly and Daily.
Both data sets are highly cited across the precipitation, climate, hydrological, agricultural, and disaster response communities. New versions of both data sets have recently been established, and plans are underway for additional improvements.
References
• Huffman, G.J., R.F. Adler, A. Behrangi, D.T. Bolvin, E.J. Nelkin, G. Gu, M.R. Ehsani, 2023: The New Version 3.2 Global Precipitation Climatology Project (GPCP) Monthly and Daily Precipitation Products. J. of Climate, 36(21), 7635-7655. doi:10.1175/JCLI-D-23-0123.1
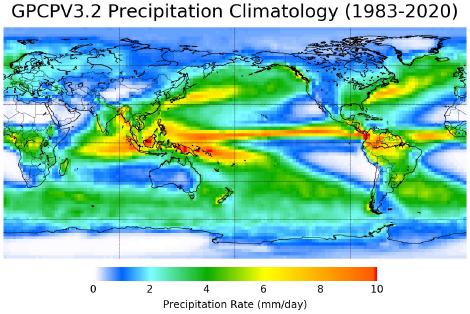
GPCP climatology of global precipitation in millimeters per day, computed from the period 1979–2020
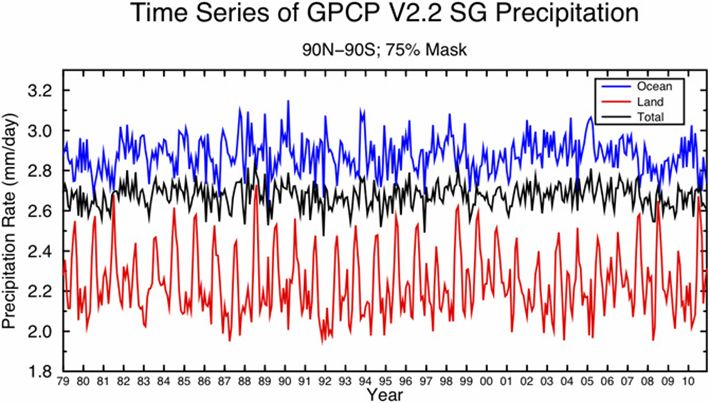
Time series of global-average GPCP Monthly precipitation in millimeters per day for ocean (blue), land (red), and all (black) areas
GSFC Disdrometer Data
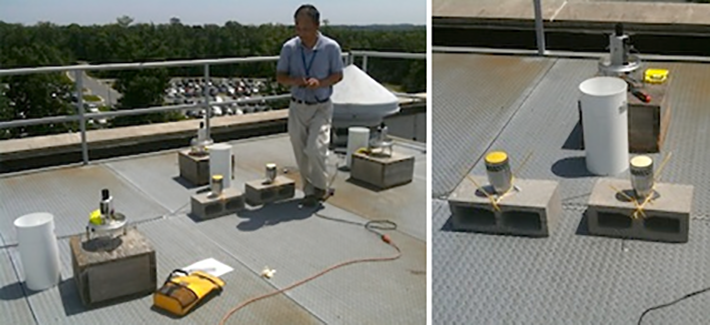
Images of disdrometers and rain gauges on the roof of the Earth Sciences building at NASA's Goddard Space Flight Center
In support of NASA's Global Precipitation Measurement (GPM) Ground Validation program, two disdrometers were placed on top of the roof of Building 33 at NASA GSFC, as well as three tipping-bucket rain gauges. Read More
Physical Retrievals of Precipitaion Rate and Structure
Estimates of surface precipitation fluxes and precipitation vertical structure from satellite sensors can be used to characterize storm structure and intensity, and to indirectly infer distributions of vertical air motion and latent heat of condensation in precipitation systems. Therefore, in aggregate, these data are also important for global hydrological and energy cycle studies. The most accurate satellite estimates of precipitation rates and vertical structure are currently derived from a combination of spaceborne weather radar and passive microwave (PMW) radiometer observations. The spaceborne radar data reveal the structure of precipitation at relatively high spatial resolution, while the PMW radiometer observations provide a measure of the vertical column-integrated water content of the atmosphere due to water vapor, clouds, and precipitation. Since these atmospheric constituents attenuate the spaceborne radar pulses that are reflected by precipitation, the PMW measurements can be used to help "attenuation-correct" the radar observations. The greater relative accuracy of combined radar-radiometer estimates of precipitation makes them useful not only for direct science applications, but also for calibrating other satellite sensors that have lower accuracy but provide greater sampling in space and time.
The figure below shows a schematic of the Global Precipitation Measurement (GPM) mission Core Observatory (CO), including the scanning of its Dual-frequency Precipitation Radar (DPR) and GPM Microwave Imager (GMI). The GPM CO launched on February 27, 2014. The DPR and GMI represent the next-generation of sensors that were flown on the Tropical Rainfall Measuring Mission (TRMM) satellite (1997–2015). The DPR's two channels generally yield more accurate precipitation particle size distribution and precipitation rate estimates. The GMI has additional higher-frequency microwave channels that are useful for light rain and snow detection.
Laboratory researchers are developing computer algorithms for diagnosing precipitation rates, vertical structure, and latent heating from a combination of the DPR and GMI data; see Bringi et al. (2021) and Grecu et al. (2016, 2018, 2024). In the pre-launch phase of GPM, these algorithms were applied to either TRMM data or synthesized GPM observations. The performance of this algorithm builds on previously-developed TRMM algorithms, but it has the advantage that it can incorporate the additional channel data from GPM (and select other sensors) to improve precipitation estimates.
Diagram illustrating the dimensions covered by the GPM Core Observatory's Dual-frequency Precipitation Radar (DPR) and GPM Microwave Imager (GMI) instruments. NOTE: As of May 2018 the KaPR swath width was shifted to 245km.
• Bringi, V., M. Grecu, A. Protat, M. Thurai, C. Klepp. 2021: Measurements of Rainfall Rate, Drop Size Distribution, and Variability at Middle and Higher Latitudes: Application to the Combined DPR-GMI Algorithm. Remote Sensing 13, 2412. https://doi.org/10.3390/rs13122412
• Grecu, M., G. M. Heymsfield, S. Nicholls, S. Lang, and W. S. Olson, 2024: A Machine-Learning Approach to Mitigate Ground Clutter Effects in the GPM Combined Radar-Radiometer Algorithm (CORRA) Precipitation Estimates. J. Atmos. Oceanic Technol., https://doi.org/10.1175/JTECH-D-24-0048.1, in press.
• Grecu, M., W.S.Olson, S.J. Munchak, S. Ringerud, L. Liao, Z. Haddad, B.L Kelley. S.F. McLaughlin, 2016: The GPM combined algorithm. Journal of Atmospheric and Oceanic Technology, 33, 2225-2245.
• Grecu, M., L. Tian, G.M. Heymsfield, A. Tokay, W.S. Olson, A.J. Heymsfield, A. Bansemer, 2018: Nonparametric Methodology to Estimate Precipitating Ice from Multiple-Frequency Radar Reflectivity Observations. J. Appl. Meteor. Climatol., 57, 2605–2622. https://doi.org/10.1175/JAMC-D-18-0036.1
Global Precipitation Estimates
Precipitation dataset users generally require levels of accuracy, coverage, and time/space resolution that are best addressed by combining estimates from several satellites, plus rain gauge data as possible. The MAPL precipitation group develops, produces, and analyzes such precipitation data sets, principally the Integrated Multi-satellitE Retrievals for GPM (IMERG; Huffman et al. 2020). IMERG is a high-resolution precipitation product (HRPP), focused on producing the best fine-scale quasi-global estimate for the TRMM and GPM eras, specifically half-hourly and monthly 0.1°x0.1° latitude/longitude gridded estimates for the entire globe for 1998-present. The main half-hourly and monthly research products are computed 4 months after observation (the Final Run), while two near-real-time versions of the half-hourly product are computed about 4 and 14 hours after observation (the Early and Late Runs, respectively). The Early and Late products provide critical input for a range of analyses, including floods, crops, and drought. See https://gpm.nasa.gov/data/directory for further discussion and pointers to the data.
The group is also responsible for the Global Precipitation Climatology Project (GPCP; Huffman et al. 2023) Monthly and Daily products, which are designed for the long-term homogeneity of Climate Data Record (CDR) standards. The Monthly provides data for 1983–present at 0.5°x0.5° resolution, while the Daily runs 1998–present at 0.5°x0.5°, both fully global. These data are important inputs for climate analysis and climate model validation. As examples, the long-term climatology of precipitation is shown in the upper panel of the following figure in millimeters per day, while the time series of global-average land, ocean, and total precipitation is shown in the lower panel as blue, red, and black lines. Go to https://disc.gsfc.nasa.gov/ and search on “GPCP” to access the most current version of the Monthly and Daily.
Both data sets are highly cited across the precipitation, climate, hydrological, agricultural, and disaster response communities. New versions of both data sets have recently been established, and plans are underway for additional improvements.
References
• Huffman, G.J., R.F. Adler, A. Behrangi, D.T. Bolvin, E.J. Nelkin, G. Gu, M.R. Ehsani, 2023: The New Version 3.2 Global Precipitation Climatology Project (GPCP) Monthly and Daily Precipitation Products. J. of Climate, 36(21), 7635-7655. doi:10.1175/JCLI-D-23-0123.1
GPCP climatology of global precipitation in millimeters per day, computed from the period 1979–2020
Time series of global-average GPCP Monthly precipitation in millimeters per day for ocean (blue), land (red), and all (black) areas
GSFC Disdrometer Data
Images of disdrometers and rain gauges on the roof of the Earth Sciences building at NASA's Goddard Space Flight Center
In support of NASA's Global Precipitation Measurement (GPM) Ground Validation program, two disdrometers were placed on top of the roof of Building 33 at NASA GSFC, as well as three tipping-bucket rain gauges. Read More