The Cosmic Ice Laboratory - IR Spectra
The Cosmic Ice Laboratory - Ammonia-Containing Ices
Files are here for figures from "Ammonia-Water Ice Laboratory Studies Relevant to Outer Solar System Surfaces" by Moore, M. H., Ferrante, R. F., Hudson, R. L., and Stone, J. N. (2007) Icarus, 190, 260-273.
| IR Spectra of NH3-Containing Ices For details, see Moore, M. H., Ferrante, R. F., Hudson, R. L., and Stone, J. N. (2007). Ammonia-Water Ice Laboratory Studies Relevant to Outer Solar System Surfaces. Icarus, 190, 260-273. |
||
| Figure | Description | Available Formats |
|---|---|---|
| Figure 1
NH3 compared to H2O+NH3 Ices 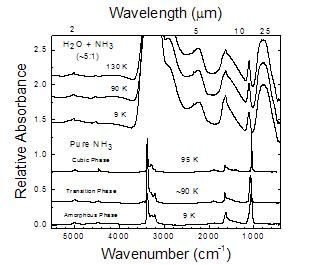
|
NH3 9 K
Amorphous Phase |
ASCII [162 kb]
SPC [40 kb] |
| NH3 ~90 K
Transition Phase |
ASCII
[154 kb] SPC [40 kb] |
|
| NH3 95 K
Cubic Phase |
ASCII
[255 kb] SPC [61 kb] |
|
| H2O + NH3 9 K | ASCII
[53 kb] SPC [15 kb] |
|
| H2O + NH3 90 K | ASCII
[50 kb] SPC [14 kb] |
|
| H2O + NH3
130 K |
ASCII
[50 kb] SPC [14 kb] |
|
| Figure 2
IR spectra of Ices made from H2O/NH3=0.5 gas-phase mixtures 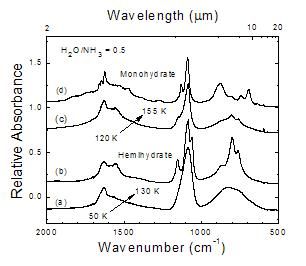
| Spectrum (a) | ASCII
[247 kb] SPC [61 kb] |
| Spectrum (b) | ASCII
[247 kb] SPC [61 kb] |
|
| Spectrum (c) | ASCII
[243 kb] SPC [61 kb] |
|
| Spectrum (d) | ASCII
[246 kb] SPC [61 kb] |
|
| Figure 3
This work compared to a hemihydrate reference spectrum 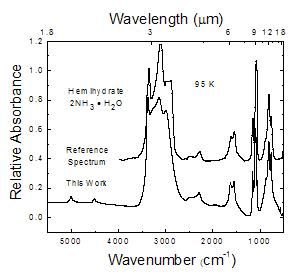 |
This Work | ASCII
[225 kb] SPC [61 kb] |
| Reference Spectrum | ASCII
[25 kb] SPC [7 kb] |
|
| Figure 4 This work compared to a monohydrate reference spectrum 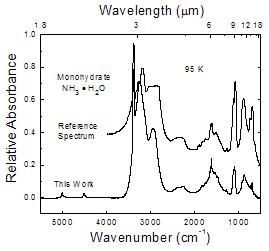
|
||
| This Work | ASCII
[286 kb] SPC [70 kb] |
|
| Reference Spectrum | ASCII
[30 kb] SPC [9 kb] |
|
| Figure 5 The thermal evolution of hemihydrate 2NH3 * H2O 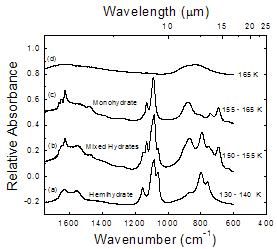 |
Spectrum (a) | ASCII
[247 kb] SPC [61 kb] |
| Spectrum (b) | ASCII
[249 kb] SPC [61 kb] |
|
| Spectrum (c) | ASCII
[246 kb] SPC [61 kb] |
|
| Spectrum (d) | ASCII
[280 kb] SPC [70 kb] |
|
| Figure 6 A comparative look at near-IR spectra from 5400 to 4000 cm-1 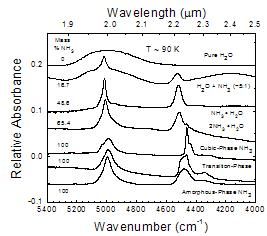 |
Amorphous NH3 | ASCII
[55 kb] SPC [24 kb] |
| Transition NH3 | ASCII
[55 kb] SPC [24 kb] |
|
| Cubic NH3 | ASCII
[255 kb] SPC [61 kb] |
|
| 2NH3 * H2O | ASCII
[225 kb] SPC [61 kb] |
|
| NH3 * H2O | ASCII
[286 kb] SPC [70 kb] |
|
| H2O+NH3 | ASCII
[50 kb] SPC [14 kb] |
|
| Pure H2O | ASCII
[55 kb] SPC [24 kb] |
|
| Figure 7 A comparative look at near-IR spectra from 5600 to 4000 cm-1 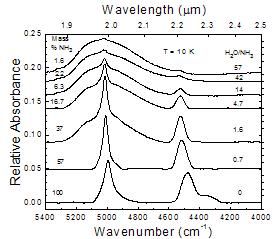 |
||
| H2O/NH3=0 | ASCII
[162 kb] SPC [40 kb] |
|
| H2O/NH3=0.7 | ASCII
[55 kb] SPC [16 kb] |
|
| H2O/NH3=1.6 | ASCII
[53 kb] SPC [15 kb] |
|
| H2O/NH3=4.7 | ASCII
[50 kb] SPC [14 kb] |
|
| H2O/NH3=14 | ASCII
[53 kb] SPC [15 kb] |
|
| H2O/NH3=42 | ASCII
[53 kb] SPC [14 kb] |
|
| H2O/NH3=57 | ASCII
[52 kb] SPC [15 kb] |
|
| Figure 9 Changes in the near- and mid-IR spectrum of 2NH3 * H2O at 50 K as a function of radiation dose 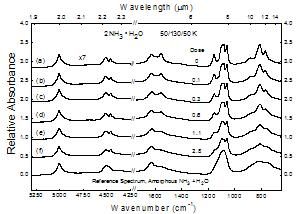 |
||
| Spectrum (a) | ASCII
[230 kb] SPC [61 kb] |
|
| Spectrum (b) | ASCII
[229 kb] SPC [61 kb] |
|
| Spectrum (c) | ASCII
[230 kb] SPC [61 kb] |
|
| Spectrum (d) | ASCII
[230 kb] SPC [61 kb] |
|
| Spectrum (e) | ASCII
[224 kb] SPC [61 kb] |
|
| Spectrum (f) | ASCII
[224 kb] SPC [61 kb] |
|
| Reference Spectrum | ASCII
[230 kb] SPC [61 kb] |
|
| Figure 10 Changes in the IR spectrum of 2NH3 * H2O before and after an irradiation of 2.8 eV molecule-1 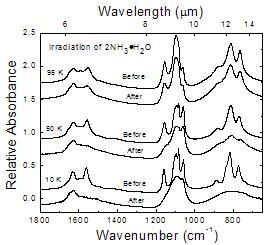 |
||
| 10 K Before | ASCII
[224 kb] SPC [61 kb] |
|
| 10 K After | ASCII
[224 kb] SPC [61 kb] |
|
| 50 K Before | ASCII
[230 kb] SPC [61 kb] |
|
| 50 K After | ASCII
[224 kb] SPC [61 kb] |
|
| 95 K Before | ASCII
[225 kb] SPC [61 kb] |
|
| 95 K After | ASCII
[224 kb] SPC [61 kb] |
|
| Figure 13 IR spectra of an H2O + NH3 (7:1) ice at 10 K before and after irradiation to a dose of 7 eV molecule-1 at 10 K 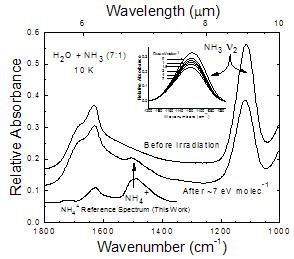 |
||
| Reference Spectrum | ASCII
[55 kb] SPC [24 kb] |
|
| Before Irradiation | ASCII
[55 kb] SPC [15 kb] |
|
| After Irradiation | ASCII
[53 kb] SPC [15 kb] |
|